01 / DISCOVERFind devices across subnets.
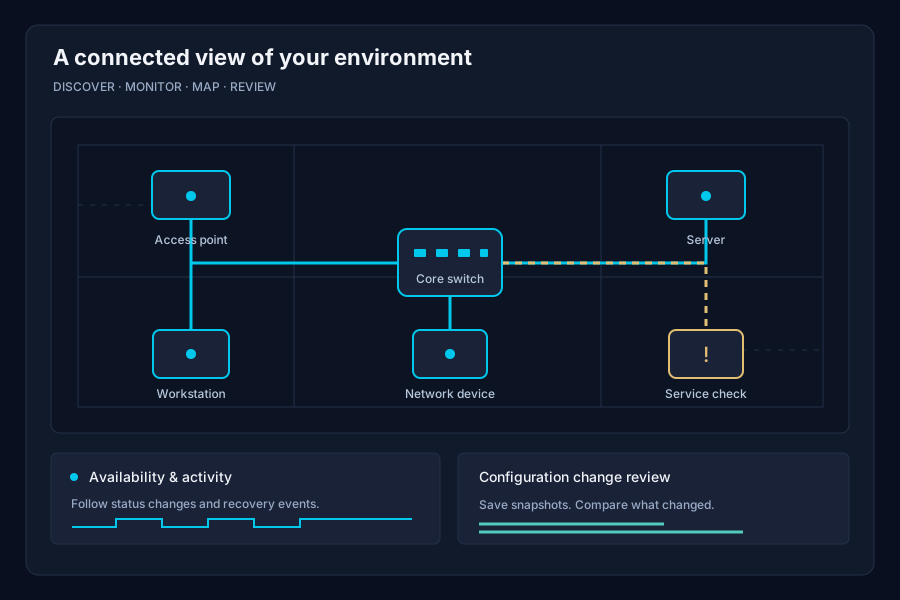
Scan selected IPv4 networks, review discovered devices, and choose what to monitor. Collect available device details through saved SNMP, SSH, or HTTPS profiles.
02 / MONITORFollow availability over time.
Check reachability through ICMP, TCP, or configured SNMP queries. Review recorded check history, uptime, outages, and recovery events.
03 / VISUALIZEPut your network in context.
Place device markers on your own maps and explore network topology using collected neighbor information.
04 / COMPAREKeep track of configuration changes.
Collect read-only configurations from supported devices using SSH or trusted HTTPS endpoints. Save snapshots and compare changes against the previous baseline.
05 / RESPONDKnow when something changes.
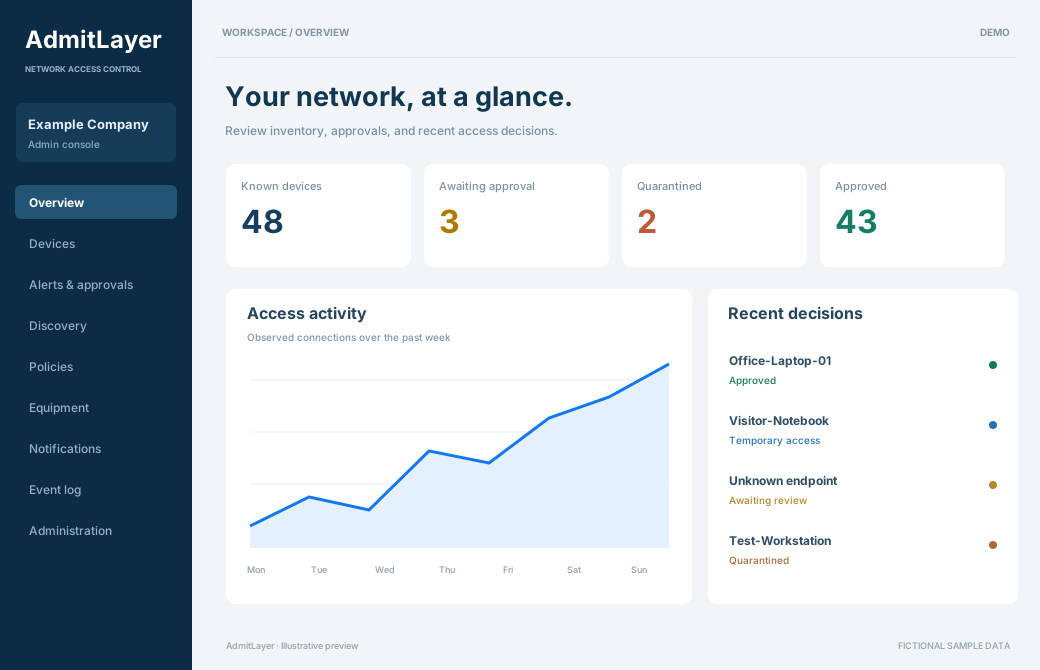
Use configured email alerts and browser desktop notifications for monitoring events. Review activity and configuration-change alerts from the dashboard.
06 / ADMINISTERMake it work for your team.
Use named accounts, MFA, and administrator, operator, or viewer roles. Customize dashboard appearance, device views, map labels, and read-only screens.
YOUR DISPLAY. YOUR VIEW.
Live monitoring, on the screen you choose.
Turn a wall screen, office monitor, or other browser-equipped display into a dedicated network monitoring view. Customize the information you want to see—from device status and map labels to summary counts, legends, and the clock—with automatic refresh to keep the display current.
Choose the layout, branding, colors, and visible details to suit your team. Read-only display access lets you share network visibility without exposing administration controls.
Discovery, inventory, topology, and configuration collection depend on device support, enabled protocols, and configured credentials. Email alerts require a supported SMTP configuration; browser notifications require an open dashboard tab.